Tech tutorials R Integration With Power BI
By Insight Editor / 8 Sep 2016 , Updated on 16 May 2019 / Topics: Analytics
By Insight Editor / 8 Sep 2016 , Updated on 16 May 2019 / Topics: Analytics
In recent years, the powerful visualization and forecasting capabilities of R have helped it emerge as one of the leading tools in the Business Intelligence (BI) and analytics space. This popularity has led to many BI tools (such as Power BI) adding R integration in order to unlock the full capability of the software.
Currently, there are three different ways to integrate R into your Power BI reports: the R script data source, the Run R Script data cleansing tool and the R script visual. In this article, we’ll explore all three so you can begin using R in your Power BI reports.
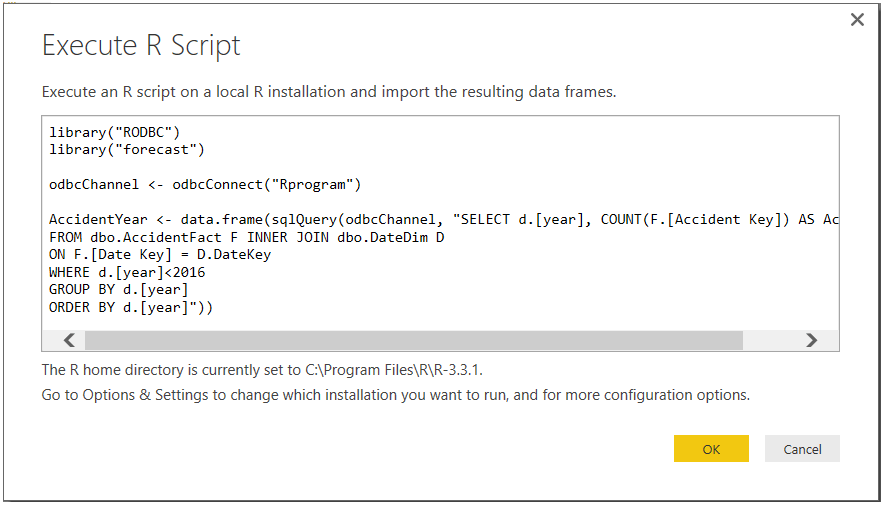
The first way to integrate R into your Power BI report is with the R script data source. The R script data source allows you to load data from any data source, even those that may not be supported by Power BI but are supported by R.
With the R script data source, you can do much more than simply load data to your model. You can also use it to blend multiple data sources and create custom columns based off R script calculations.
To import data using R, simply write your R script in the Execute R Script window and run it. As a best practice, it’s always good to test your R script in a program such as RStudio first to be sure it runs without any errors. Once you’ve tested your script, you can enter it into the Execute R Script window and load your data to Power BI.
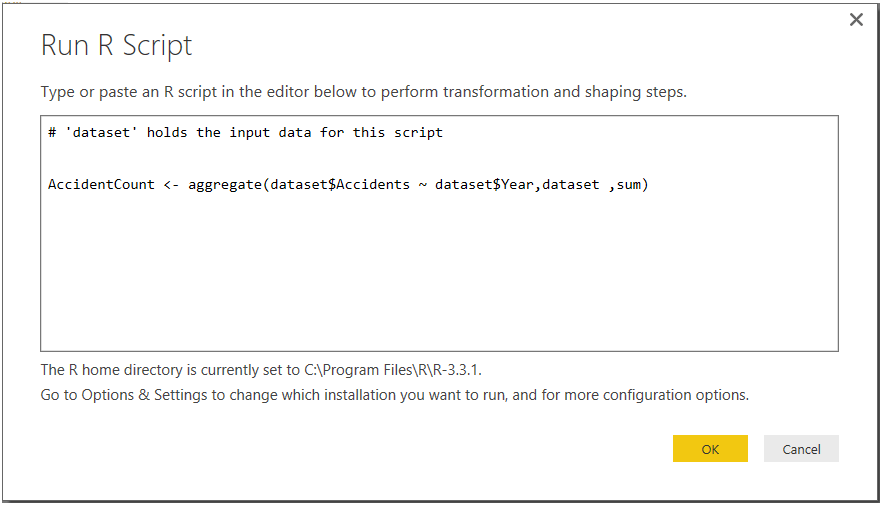
A second way to integrate R into your Power BI reports is with the data cleansing tool. The July 2016 Power BI update included a new feature that allows us to add R steps in the Query Editor to enhance our data. This new feature gives us the ability to reshape the data, perform powerful statistical calculations available in R and add new columns to our data set.
Additionally, we can use R to score the data for use in predictive models. You can find the new Run R Script feature by opening Query Editor, navigating to the Transform tab and clicking Run R Script on the far right of the ribbon.

Once selected, a Run R Script box will appear with the comment ‘# 'dataset' holds the input data for this script.’ What this means is that all of the data from your previous step is now contained in the new data frame called ‘dataset,’ from which columns in that data frame can be accessed using the ‘dataset$ColumnName’ syntax. Using this data frame, you can write an R script to cleanse and perform calculations on the data.
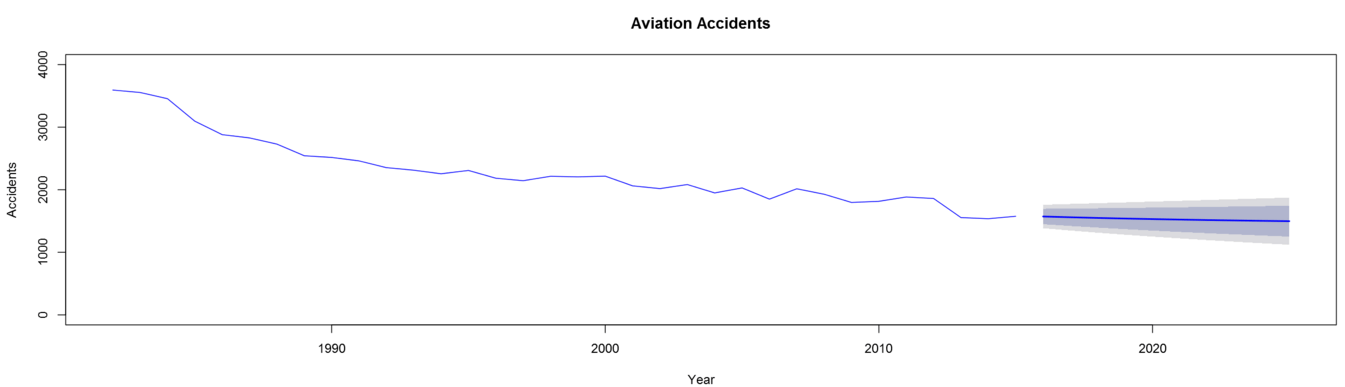
The final way to incorporate R into your Power BI reports is with the use of R script visuals. R script visuals are a great way to unlock visualizations and predictive capabilities that aren’t currently offered in Power BI.
R visuals can be created from any data source and can be added to your report with as little as one line of script. Once an R script visual is added to your report canvas, an R script editor will appear at the bottom of the canvas. As you add dimensions and measures to the visual, you’ll notice some auto-generated script in that R script editor.
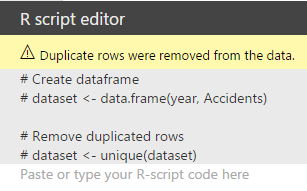
Just as in the Run R Script data cleansing step, a data frame called ‘dataset’ is created for you with duplicate rows removed. Your visual needs to be created from this data frame. Once your script is ready, click the Run button  in the top right corner of the R script editor pane to refresh your visual.
Power BI has made it easier than ever for developers to unleash the capabilities of R in their reports. R allows us to load our own custom script as a data source, perform complex calculations and data cleansing on the back end, and use new and exciting visualizations that aren’t currently available to us in Power BI.
R has really opened the box for Power BI users in terms of how they can manipulate and view the data in their reports. The capabilities are there for us to get more out of our data than ever before, but it’s up to us to take advantage of these features.
Advertisement