Tech tutorials Using a SharePoint List as a Data Set in Excel
By Insight Editor / 1 Oct 2013 , Updated on 16 May 2019 / Topics: Agile
By Insight Editor / 1 Oct 2013 , Updated on 16 May 2019 / Topics: Agile
There are different ways to manage projects, and using SharePoint for project management is a very useful technique. I worked with a client whose project management methodology was something between Agile and Waterfall.
The company organized tasks and features into iterations, but the work itself was organized into something resembling a Work Breakdown Structure (WBS) of the type you’d see in Microsoft Project. However, instead of using a traditional project management application to assist in managing requirements, tasks and resources, the client used SharePoint.
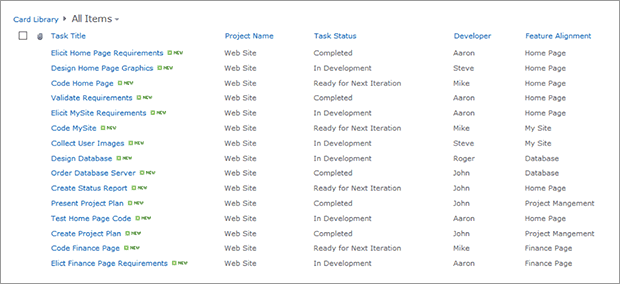
Figure 1: Sample standard SharePoint list customized for task management
The WBS, requirements and resource assignments exist in a customized SharePoint list where each item or row, if viewed in a table format, is one actionable task. All the information needed for that task is built in to the metadata for that item. There are fields for requirements, estimates, an assigned resource, feature alignment and more.
There are a lot of obvious benefits of using SharePoint for project management, including its inherent transparency and flexibility. But there's another way using SharePoint can give even more insight to your project: viewing the data in Excel. Here's how:

At the top of the SharePoint page, select the List ribbon. The Export to Excel button should now be visible. Clicking that will cue Excel to open and import the SharePoint list as a data set and display it in a table format.
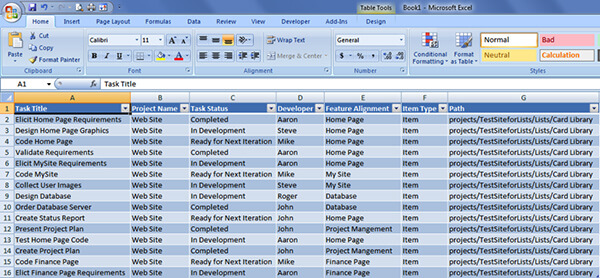
Figure 2: SharePoint task list exported to Excel
From here, you can do all of your traditional Excel tasks. You can filter and sort, use formulas, copy and paste, or whatever you may need. It’s important to note that any changes made to the data in the Excel sheet WILL NOT be synced to SharePoint. The data connection is only one direction: SharePoint > Excel.
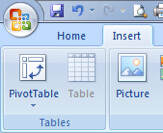
To take it a step further, select the Insert ribbon in Excel and click Pivot Table. By default, it will select the table you’ve imported and create the pivot table on a new sheet. Drag and drop the metadata fields (table columns) from the Field List on the top right into the areas below to create a dynamic table.
For example, you can drag Project into the Report Filter, Feature Alignment to Row Labels, Card Status to column labels, and Task Status to Values. This will display a list of all features within the project and the status of all tasks within that project by quantity. Essentially, this is a snapshot of the status of the project, organized by feature.
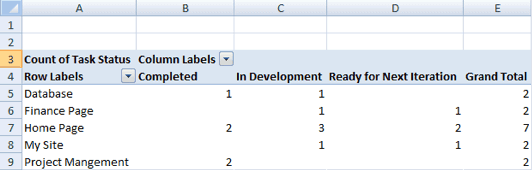
Figure 3: Pivot table showing tasks by status for each feature
You could do a similar structure but with team members listed in the Row Labels. This can show you how many tasks are assigned to each person and the status of those tasks.
Pivot tables can be as simple or complex as you’d like. You can have the table provide sub and grand totals, filter by multiple attributes and sort data.
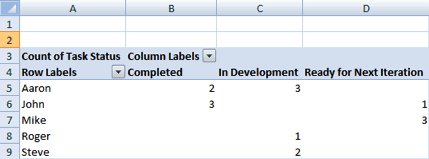
Figure 4: Pivot table showing tasks by status for each developer
If a more graphical view of your data is desired, you can do that too. On your pivot table sheet, select the Options ribbon and click Pivot Chart. The standard Excel chart pop-up will appear and allow you to choose a chart type. Once you make your selection and click OK, Excel will create a chart based on your imported data.
Don't worry if you select the wrong chart type — simply right-click on the chart and select Change Chart Type… to choose another. You may also need to re-sort your table so that it’s organized the way you’d like it to appear in the chart.

Figure 5: Pivot chart showing Figure 4 data visually
You can create multiple charts from the same data set, which can be useful for creating dashboards for the data held in SharePoint. When you save the Excel sheet, it will retain the data that was already imported but not reflect any changes made to the SharePoint list since that time unless you refresh the data.
Refresh by selecting your sheet containing the SharePoint data, then choose the Data ribbon and click Refresh All. This will reach out to the SharePoint server and re-download the data. Your tables and charts will automatically update with the new data.
This technique has proven very useful when using SharePoint for project management but could be equally as effective for any other data stored in SharePoint.
Advertisement